Swing trading is a popular trading style that allows traders to capture short to medium-term price movements in any stocks, commodities, or forex. Unlike day trading, which involves making numerous trades in a single day, swing trading typically spans several days to weeks or up to few months, providing a favourable balance between risk and reward. In this blog post, we’ll explore some of the best swing trading strategies to help you maximize your profits with a minimized risk.
5 Best swing trading strategies
1. Breakout strategy using Trendlines
Breakout trading involves entering a position when the price breaks out a significant level of support or resistance. To find the breakout we can use trendline, as this is the most reliable tool that indicates that the price is now entering into a new price zone, leaving the old one. The trendline is drawn by combining two peak points of either tops or bottoms and whenever the price reaches this trendline in the future, there is a high probability that the price will see again a reversal from there. However when the trendline is crossed, well supported by the volume, then it is considered as a breakout, and that will lead its prices to move in that direction further. This scenario creates an opportunity for a swing trader to establish their positions and ride the trend with managed risks. This strategy is highly used and among the best swing trading strategies.
Varieties in trendlines:
- Horizontal trendline
- Diagonal trendline
- Channeling

Horizontal trendlines– This trendline is formed when any security faces support or resistance on the same price level again, as it faced the first time, and a reversal occurs this level is called a price rejection level or a price zone of accumulation or distribution. Whenever the price reaches this level again, the trend is likely to reverse the direction from there.
Diagonal trendline– These trendlines are either upward-slopping or downward-sloping trendlines. These trendlines are built by connecting two peak points of either the highest or lowest price levels registered at different price zones. An Upward-sloping trendline is drawn to find supports, while the downward-slopping trendline is used to find the resistance level in an established trend.
Channeling– if the price is traded within 2 horizontal or diagonal trendlines, that prize zone develops a range that is called a channel. So whenever we see a range breakout then the trend is likely to follow that direction.
2. Trend following Strategy using moving averages
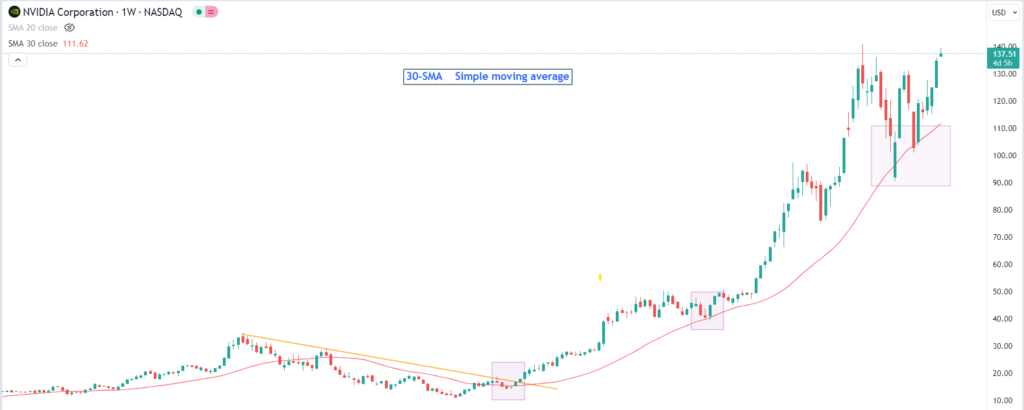
The moving average is the most widely used indicator in technical analysis to follow an established trend. This indicator helps to form the most effective and best swing trading strategies in trend identification and following the trend.
A moving average is a statistical calculation created by price averages over a specific period from the immediate past. In trading, moving averages help smooth out price data to create a clearer view of a stock’s or asset’s price trend.
Based on the strategy and purpose of use there are 3 types of moving averages.
Simple moving average
Exponential moving average
Weighted moving average
The simple moving average is the average people use most often, and it tends to show how prices are changing. But keep in mind, that you need to know which period works best for different timeframes when using moving averages. People use different moving averages for different reasons, depending on the time period they cover.
For trading – (9 SMA and 14 SMA)
For swing trading & short-term investment – 20 SMA and 30 SMA)
For long-term Investments – 50 SMA, 100 SMA & 200 SMA
Weekly candle charts perform better as they absorb the volatility of daily candles and render smoothness in trend and the traders are in a better situation to manage their psychology and carrying the positions.

3. Price action Patterns for reversal or trend continuation
Price action trading focuses on analyzing chart patterns to make trading decisions, often without relying on indicators. Swing traders, in particular, can gain significant insights from identifying certain price action patterns, which may indicate potential market reversals or continuations. However, it is important to note that there is no specific pattern that can be definitively emphasized here; the uncertainty of its development in the chart is a notable concern. Although some price action patterns are suggested, they can assist traders in positioning themselves in alignment with the prevailing trend whenever a pattern arises.
Bullish Patterns
- Double bottom and triple bottom
- Inverted head & shoulder
- Bullish flag pattern
- Bullish pennant pattern
- falling wedge pattern
- bullish contracting/expanding triangle
- bullish symmetrical triangle
- Ascending triangle
Bearish Patterns
- Double top and triple top
- bearish head & shoulder
- Bearish flag pattern
- Bearish pennant pattern
- Rising wedge pattern
- bearish contracting/expanding triangle
- bearish symmetrical triangle
- Descending triangle
Certain supplementary chart formations arise from a remarkably limited quantity of candles; however, they maintain considerable effectiveness in their context. Among these formations are the Pin bar, Hammer, Hanging man, Marubozu, Engulfing, Harami, and a lot more. Although they might appear straightforward, this apparent simplicity can be deceptive, because their ramifications can be quite deep. Each pattern, despite its conciseness, provides insights that can greatly affect trading choices.
4. MACD indicator for swing trading
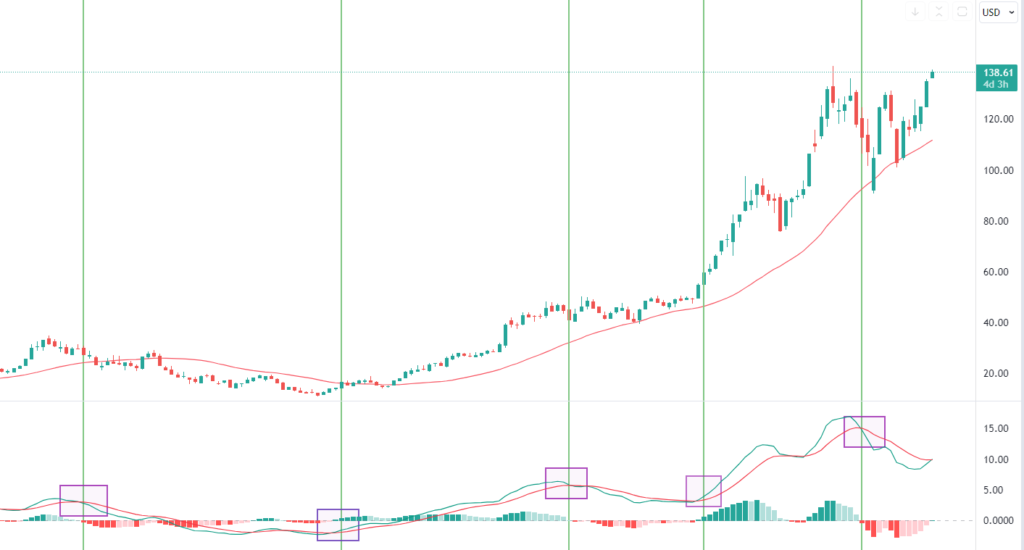
The MACD is a popular momentum indicator that helps traders identify potential reversals or continuations in a trend. MACD has two main components: the MACD line (the difference between the 8-day and 16-day exponential moving averages) and the signal line which is the 11-day EMA of the MACD indicator. When the MACD line crosses above the signal line, it generates a bullish signal, suggesting that it may be a good time to enter a long position. Conversely, when the MACD line crosses below the signal line, it indicates a bearish trend, signaling a potential opportunity to sell or short.

Additionally, pay attention to the MACD histogram, which represents the strength of a trend, if candle bars in histograms are increasing in size, that indicates that the trend is moving in the shown direction with strength, while decreasing bars might indicate a weakening momentum.
For more reliable signals, combine MACD analysis with other technical indicators and price action to ensure that your swing trades are well-timed and supported by multiple forms of analysis.
Integrating financial astrology into swing trading involves analyzing celestial events and their potential impacts on market movements to enhance your trading. Start by observing lunar phases, as new moons may signal ideal times for entering positions, while full moons can lead to increased volatility, prompting caution or profit-taking. Pay attention to planetary influences; for example, during Mercury retrograde, you might avoid making significant trades due to potential miscommunication and uncertainty. Additionally, consider the zodiac signs associated with different sectors— Aries could benefit Defence stocks, while Taurus might indicate favorable conditions for commodities like sugar, food & beverages. Whenever there is a transit of important planets through these signs, some fundamental changes and subsequent price shifts are likely to transpire during the period. You can identify potential entry and exit points more effectively by aligning astrological insights with technical indicators, such as moving averages or RSI. Keeping a trading journal to document astrological events alongside trade outcomes will help refine your approach over time, allowing you to blend intuition with analysis in your swing trading endeavors.
Conclusion
Swing trading often proves to be the most lucrative approach when compared to intraday trading or long-term investments, (as it effectively harnesses valuable time and funds) in potentially appreciating securities while simultaneously exiting underperforming ones. The most effective and the best swing trading strategies—such as trend following, breakout, and reversal strategies—each offer distinct advantages; however, only those traders who practice and apply them appropriately can truly excel.
Nonetheless, it is essential to recognize that attaining success in swing trading necessitates discipline, robust risk management, and an ongoing commitment to learning.
